Evidence level Prototypeone orthophoto · no performance reported · grey levels, not °C
A YOLO model trained on automatically generated labels finds the panels in a thermal orthophoto, so each panel can be judged against itself rather than a fixed temperature.
Key figures
- panels labelled automatically, no hand drawing
- 442 classical pipeline
- flagged per panel
- Hot spots prototype
- flagged per panel
- Cold zones objective
- PV thermography
- per-panel normalisation
- instance segmentation
- automatic labelling
- tiled inference
What’s original
- Relative, not absolute. Each panel is compared with itself first: cells on one panel share the same sun, angle and wind, so a local deviation says more than a raw value.
- Labels without hand drawing. The training polygons come from a classical contour pipeline, then each panel is turned into several rotated and sheared views so the model ignores orientation.
- Masks, not boxes. The model outlines each panel to the pixel, so the statistics exclude the ground between rows, which can be much warmer or colder than the panels.
How it works
A drone flight turns the plant into one thermal orthophoto. Hot spots usually point to faulty cells, bypass diodes or soiling; cold zones to shading, reflections or modules not working like their neighbours. The model finds every panel on overlapping tiles of the orthophoto, and a per-panel step flags pixels well above the panel’s own level. Dotted arrows are objectives.
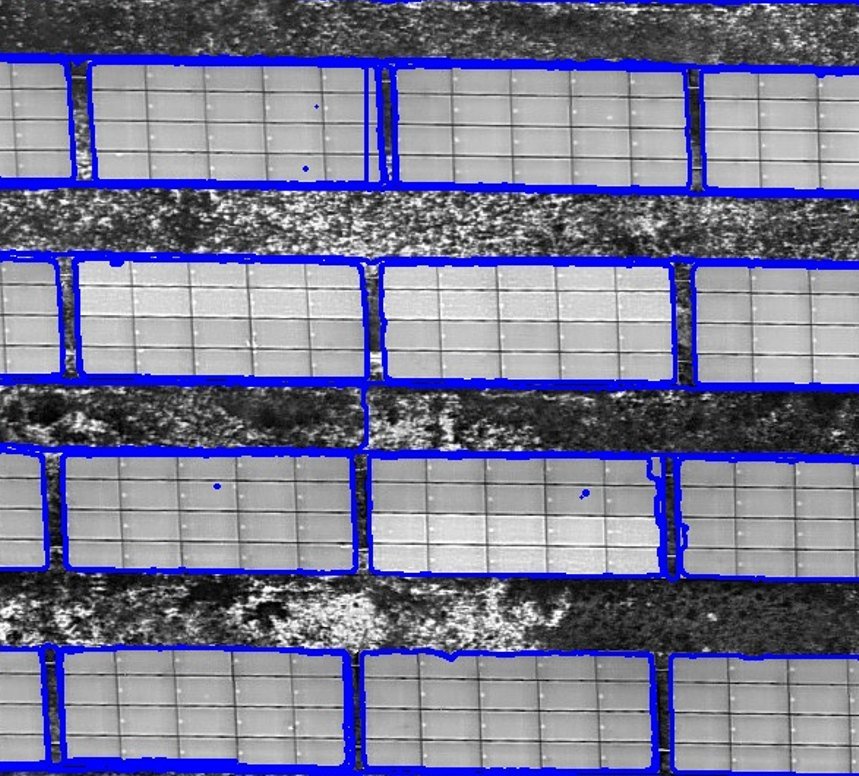 Hot-spot prototype on a detail of the orthophoto: panel outlines (blue) and flagged peaks (dots). Not checked against field inspection.
Sources: one thermal drone orthophoto, 2025 · illustration from a project presentation
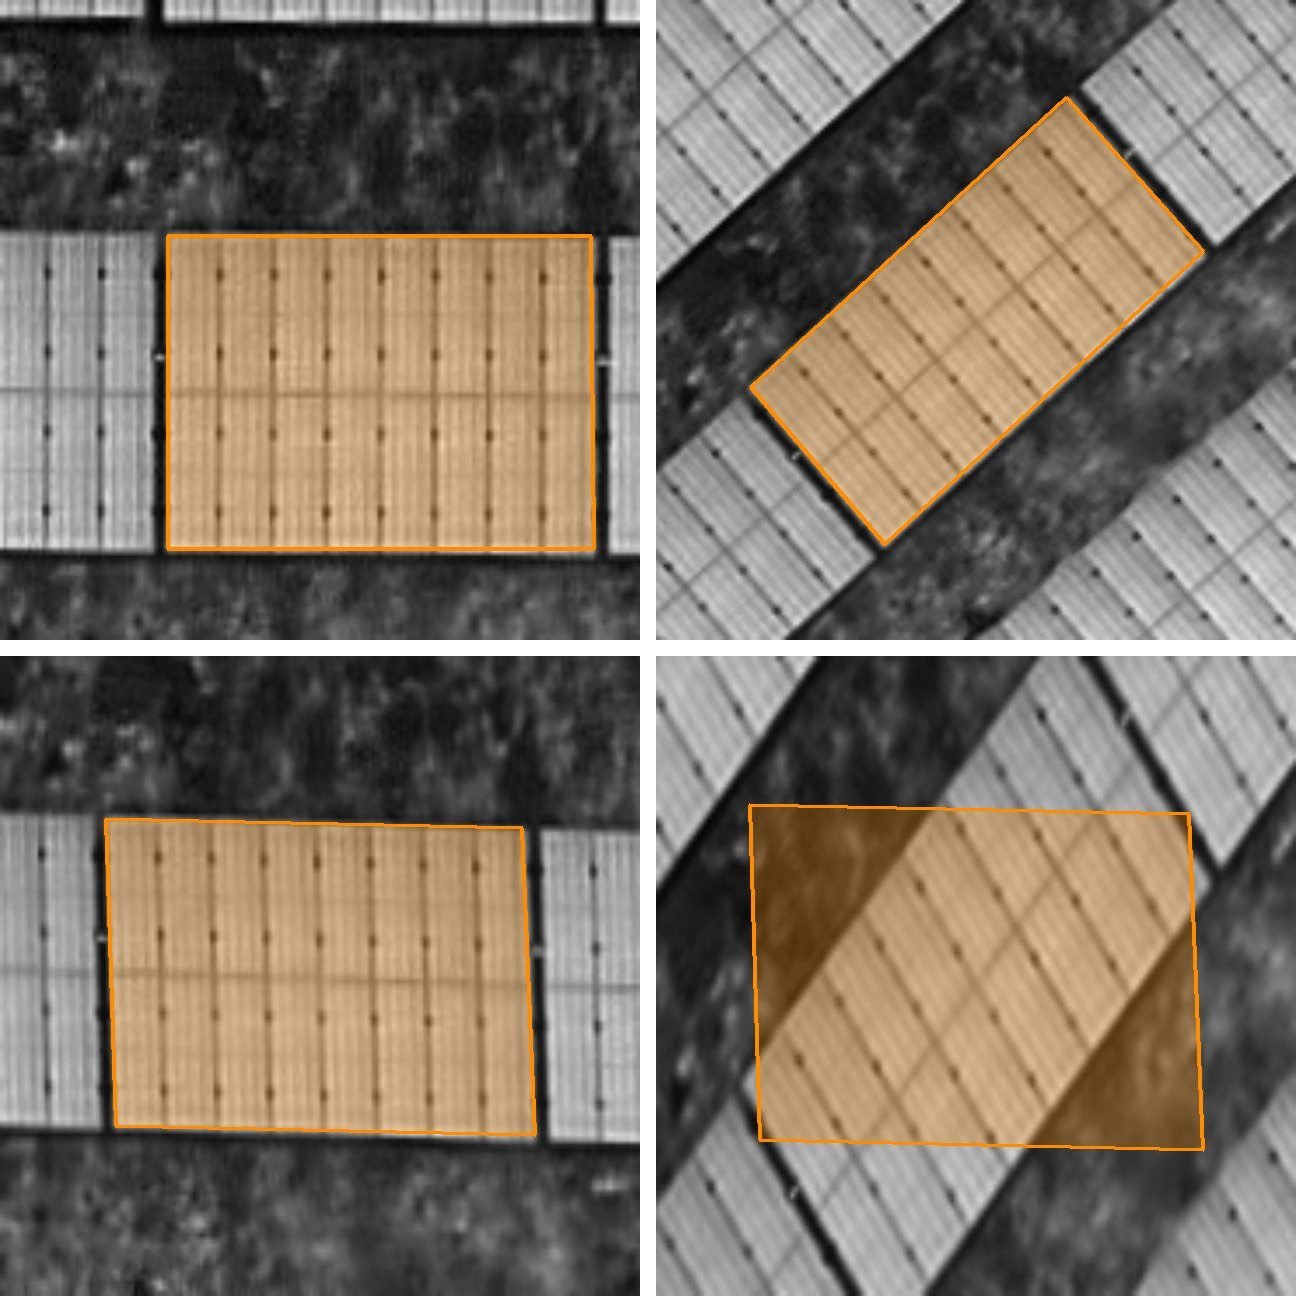 Four views generated from one automatically labelled panel. In the last view the label is not rotated with the image, a bug found on inspection.
Results
- A YOLO segmentation model fine-tuned on automatically labelled panels, and a tiled inference step that returns one crop per panel over a full orthophoto.
- A per-panel hot-spot prototype that normalises each panel by its own grey level and marks candidate peaks.
- Two side tracks explored for finding panels without training: straight-line grouping and Segment Anything.
Evidence & limits
- No performance reported. The training and evaluation results stay on the compute machine and are not available; neither panel localisation nor hot-spot detection has been scored or checked in the field.
- Labels and split are weak. Labels inherit the classical pipeline’s misses; the views of one panel fall in several splits, and training, validation and test all come from a single orthophoto.
- Grey levels, not temperatures. The orthophoto is an uncalibrated greyscale export, so thresholds depend on the colour scale chosen at export.
- Thermal step is a prototype. Only hot spots are flagged, on the prototype’s own outlines rather than the YOLO masks; cold zones and neighbour comparison are not implemented.
Technical details
Next steps. Regenerate the mislabelled rotated-and-sheared views, label every panel in each tile, split by panel and test on held-out sites; mask no-data areas and merge masks rather than boxes at tile edges; run the thermal statistics inside the YOLO masks, add a robust cold-zone test and compare each panel with its row.
Side tracks. Grouping straight Hough segments into parallelograms, and Segment Anything on tiles, were tried as label-free ways to find panels.
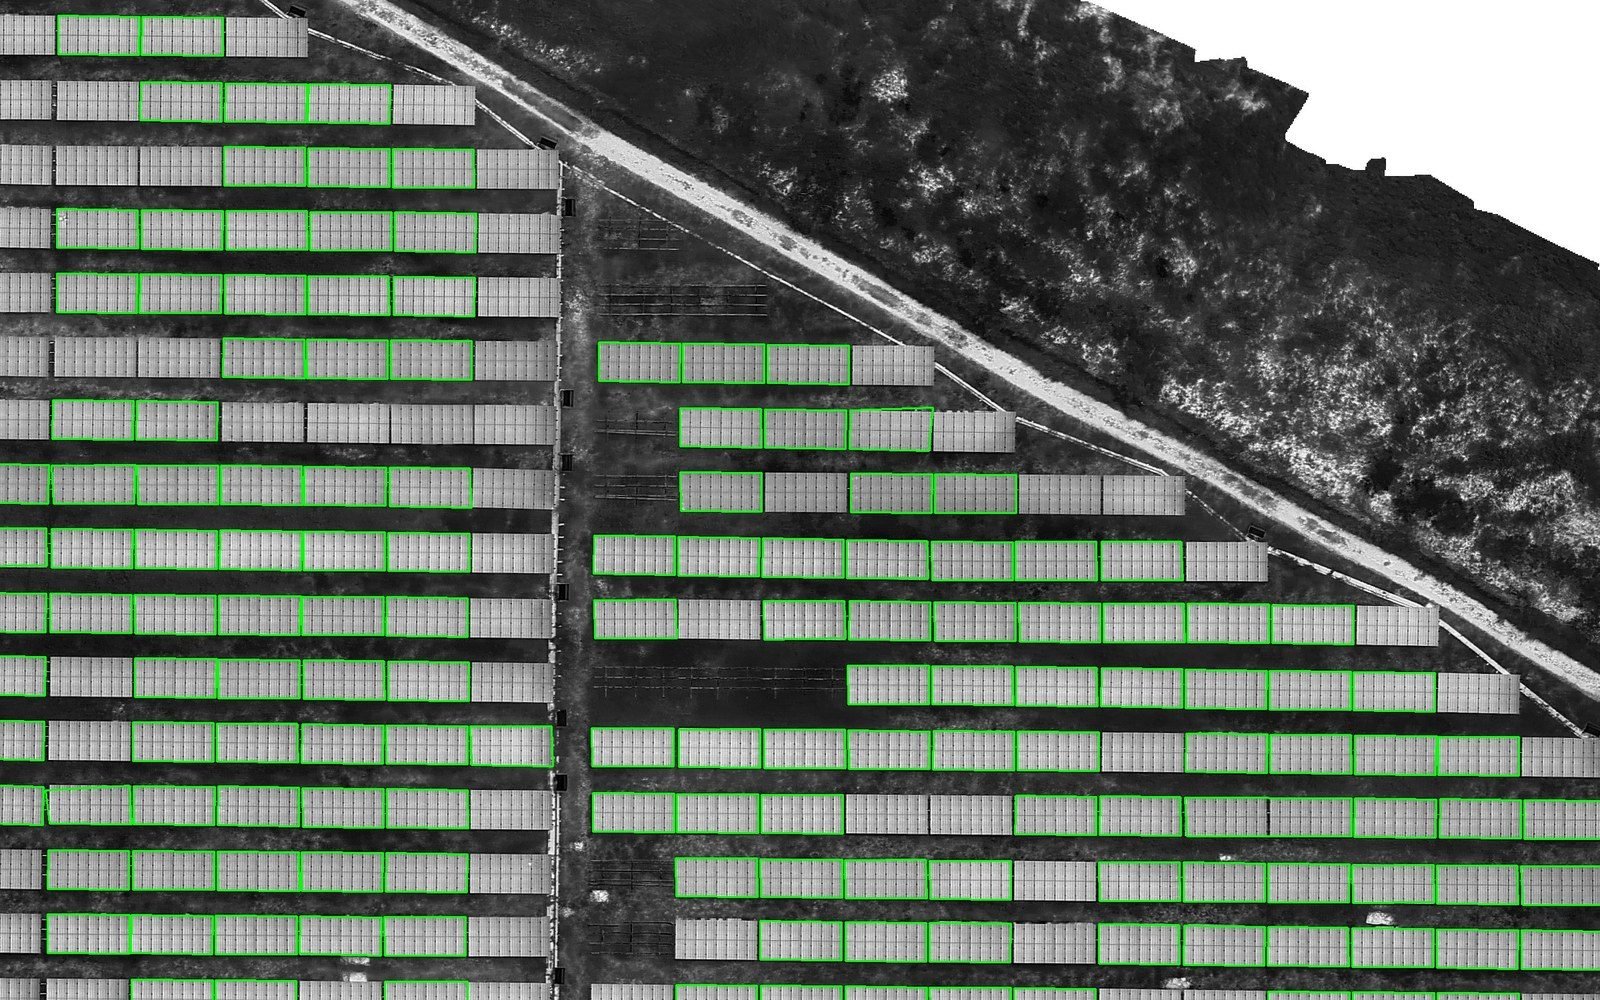 The classical contour pipeline: polygons like these became the training labels. Some tables have none, so the model can only learn what the pipeline found.
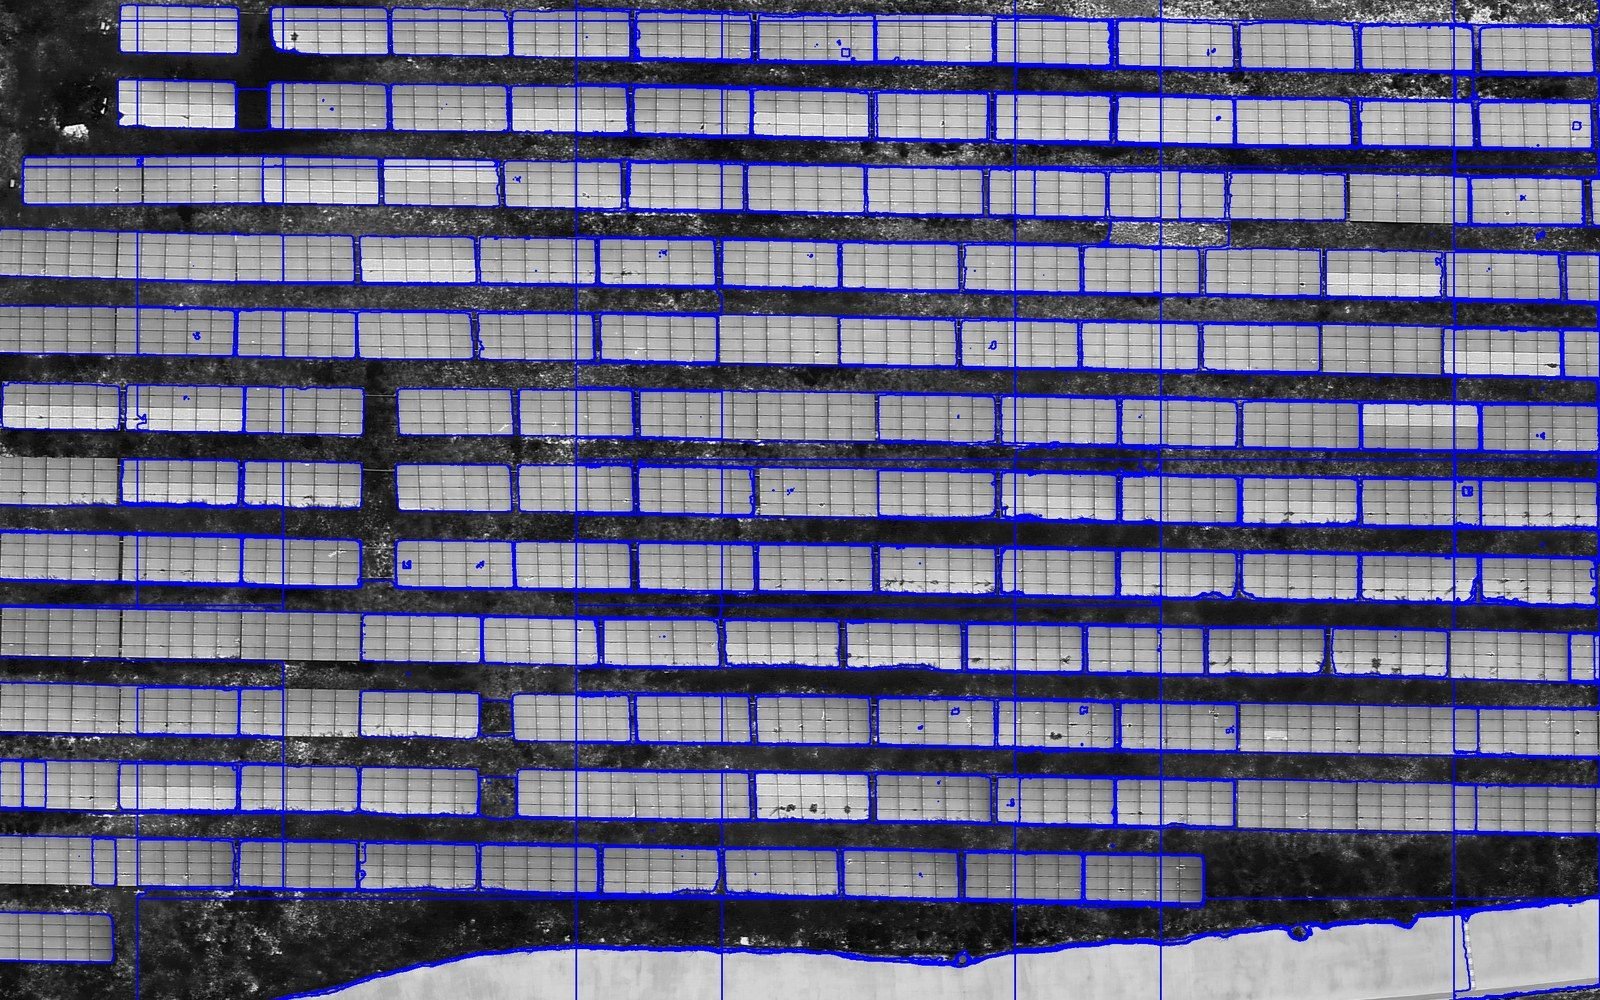 Side track: Segment Anything outlines most tables without training, but leaves seams at tile edges and contours on the road and ground.
Stack
Python · OpenCV · NumPy · Ultralytics YOLO · PyTorch · Segment Anything